The Unemployment Rate Has a Seventh Number. It Is 24.9 Percent.
In July I showed you the six unemployment rates the government publishes and why you only ever hear one. A think tank founded by a former Comptroller of the Currency publishes a seventh. It does not count whether you have a job. It counts whether the job is worth having.
By Bryan T. Pena · Seasoned.Work · September 15, 2026
Same Labor Market, Four Answers · Summer 2026
U-3
4.1%
The official rate. Jobless, searching, available
U-6
7.7%
Adds involuntary part-time and marginally attached
TRU
24.9%
Adds anyone earning under $26,000 a year. Share of labor force
TRU OOP
53.8%
Same test, measured against the whole working-age population
U-3 and U-6 are BLS, August 2026. TRU and TRU OOP are LISEP, July 2026 (latest published). Not seasonally comparable to the decimal; the shape is the point.
The Seventh Number
Two months ago I walked through U-1 to U-6 and argued that the headline unemployment rate was never designed to carry the weight we put on it. The mail that followed split into two camps. One camp wanted harder data, and I gave them the tax records and the weekly claims in August. The other camp asked a better question: fine, six numbers, but every one of them still treats a job as a job. Is anybody counting whether the job pays?
Somebody is. The Ludwig Institute for Shared Economic Prosperity, LISEP, founded by Gene Ludwig, who ran the Office of the Comptroller of the Currency under Clinton, publishes a monthly figure it calls the True Rate of Unemployment. The name is a marketing decision and I will come back to that. The definition is the useful part. LISEP counts you as functionally unemployed if you have no job, or if you want full-time work of 35 hours or more and cannot get it, or if you do have a job and it pays less than $26,000 a year before taxes in 2025 dollars. Any one of the three and you are in.
For July 2026, the most recent month published, that number was 24.9 percent of the labor force. The official U-3 rate for the same month was 4.1 percent. Same survey, same people, same month. One measure says one in twenty-five. The other says one in four.
What the Gap Is Made Of
The 20-point spread between the two numbers is not a rounding error or a methodology trick. It is a definition of employment. The BLS counts you as employed if you worked one hour for pay in the survey week. That is a deliberate choice, made in 1940, when the point of the survey was to measure the absence of work, not the quality of it. LISEP starts from the other end. It asks whether the work you have would let you live on it, and it draws the line at a full-time schedule and a poverty-adjacent wage.
So the seventh number stacks three populations. The first is the unemployed, the people U-3 already counts. The second is the involuntary part-timers, the people who want 35 hours and are getting 20, whom U-6 already counts. The third is the group nobody else counts: people working full-time hours for less than $26,000 a year. That third bucket is where most of the gap lives, and it is invisible in every government measure, because from the BLS's point of view those people are the success story. They are employed.
Who each number counts
Every measure starts with the same labor force. They differ only in where they stop counting a job as a job.
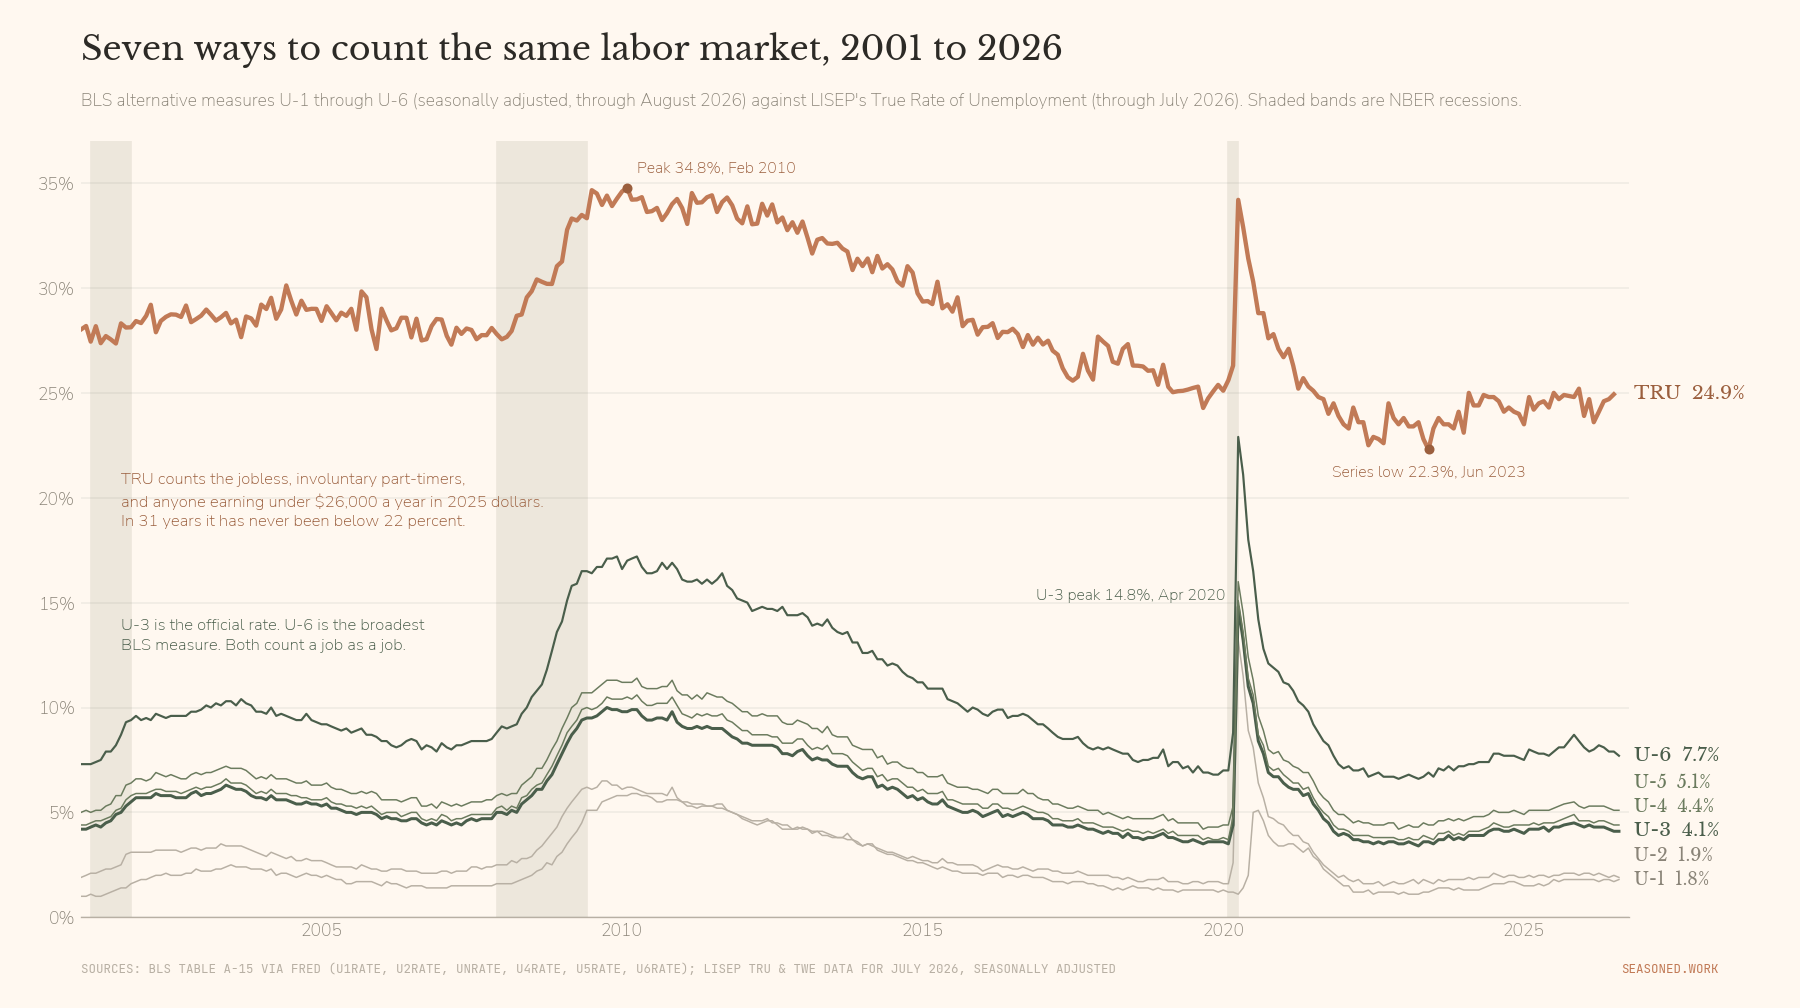
Two honesty notes, because this series does not do hype. First, 24.9 percent sounds apocalyptic and it is not new territory. LISEP's own series peaked at 34.8 percent in February 2010, sat above 30 percent for most of the decade that followed, and bottomed at 22.3 percent in June 2023. Today's 24.9 percent is lower than roughly 85 percent of the months since the series begins in 1995. At least one analyst has pointed out that, measured against its own history, the True Rate of Unemployment is currently near its best levels ever, which is an odd thing to say about a number that starts with a two. The level is a statement about how the American labor market has always been built. The trend is the news. Second, the thresholds are fixed and somewhat arbitrary. Thirty-five hours and $26,000 are reasonable lines, but a different reasonable line moves the number by several points, and "True Rate" is a name chosen to win a headline, not a peer-reviewed claim. Read it as what it is: one carefully defined measure of how many people have a job that does not function as a job.
Seven ways to count the same labor market, 2001 to 2026
U-1 through U-6 against LISEP's True Rate of Unemployment. The seventh number has never been below 22 percent, and it has been much higher than today for most of the past 25 years.
Sources: BLS Table A-15 via FRED; LISEP TRU and TWE Data for July 2026
Seasoned.Work
Why the Trend Is the News
With those caveats logged, here is what the July release actually says. The functional unemployment rate rose for the fourth consecutive month. It is up 1.3 points since March. It sits just under its December 2025 peak of 25.2 percent. Over the same stretch the headline rate drifted down from 4.5 percent last November to 4.1 percent, and the new Fed chair told markets the economy is at or near full employment. Two instruments pointed at the same labor market, pulling in opposite directions.
Ludwig's read is blunt: "Functional unemployment is moving higher while workforce participation is moving lower. If this continues, it would suggest the labor market is losing strength despite what we may see in the headline unemployment numbers." That participation point matters. LISEP also publishes a version of the number measured against the whole working-age population rather than the labor force, which it calls TRU Out of the Population. It stood at 53.8 percent in July. More than half of working-age Americans either have no job or have one that does not clear the bar. When people leave the labor force entirely, the official rate improves and this number gets worse. You can decide which one is describing the country you live in.
The demographic cut is where a Gen X reader should slow down. Women were at 31.0 percent in July, the highest since March 2021, against 19.5 percent for men, an 11.5-point gap that widened in a single month. By education, workers with a bachelor's degree were at 16.8 percent and workers with an advanced degree at 12.8 percent. One in six degree holders in the labor force is jobless, stuck part-time, or earning under $26,000. That is not the demographic the phrase "functionally unemployed" conjures. It is a large share of the people who read this site.
7
$26K
Annual pay line below which LISEP counts a full-time worker as functionally unemployed (2025 dollars)
LISEP methodology
31.0%
Functional unemployment among women in July, the highest since March 2021. Men: 19.5%
LISEP, Jul 2026
$1,033
True Weekly Earnings, Q2 2026, counting part-timers and job seekers. The BLS full-time median: $1,251
LISEP TWE, Q2 2026
106%
Rise in the cost of a minimal, secure life since 2001. CPI over the same period: 77%
LISEP True Living Cost
The Job After the Job, and the Age Cut Nobody Publishes
Here is where the seventh number connects to everything else I have written in this series. When an experienced professional gets screened out of full-time employment at 52, they do not usually show up in U-3. They show up in the third bucket. They take the contract gig that pays by the project. They do the "fractional" role that is really 15 hours a week. They call themselves consultants and clear $24,000 in a year that used to pay six figures. From the BLS's point of view every one of those people is employed and the labor market is healthy. From LISEP's point of view they are functionally unemployed, and the count is going up.
LISEP does not publish an age cut in its monthly release. So I ran one. LISEP's method is public and the underlying data is the Census Bureau's monthly Current Population Survey, the same survey the official rate comes from. I applied LISEP's three tests to the outgoing rotation groups for May through August 2026, pooled for sample size, covering wage and salary workers plus the unemployed. Two caveats up front. LISEP handles the self-employed through a separate annual dataset that I did not replicate, so my figures leave them out, and the numbers are not seasonally adjusted. On that basis my all-ages figure comes out at 22.5 percent against LISEP's published 24.9, which is the right direction of error for a version that omits the self-employed. Treat the age figures as a floor.
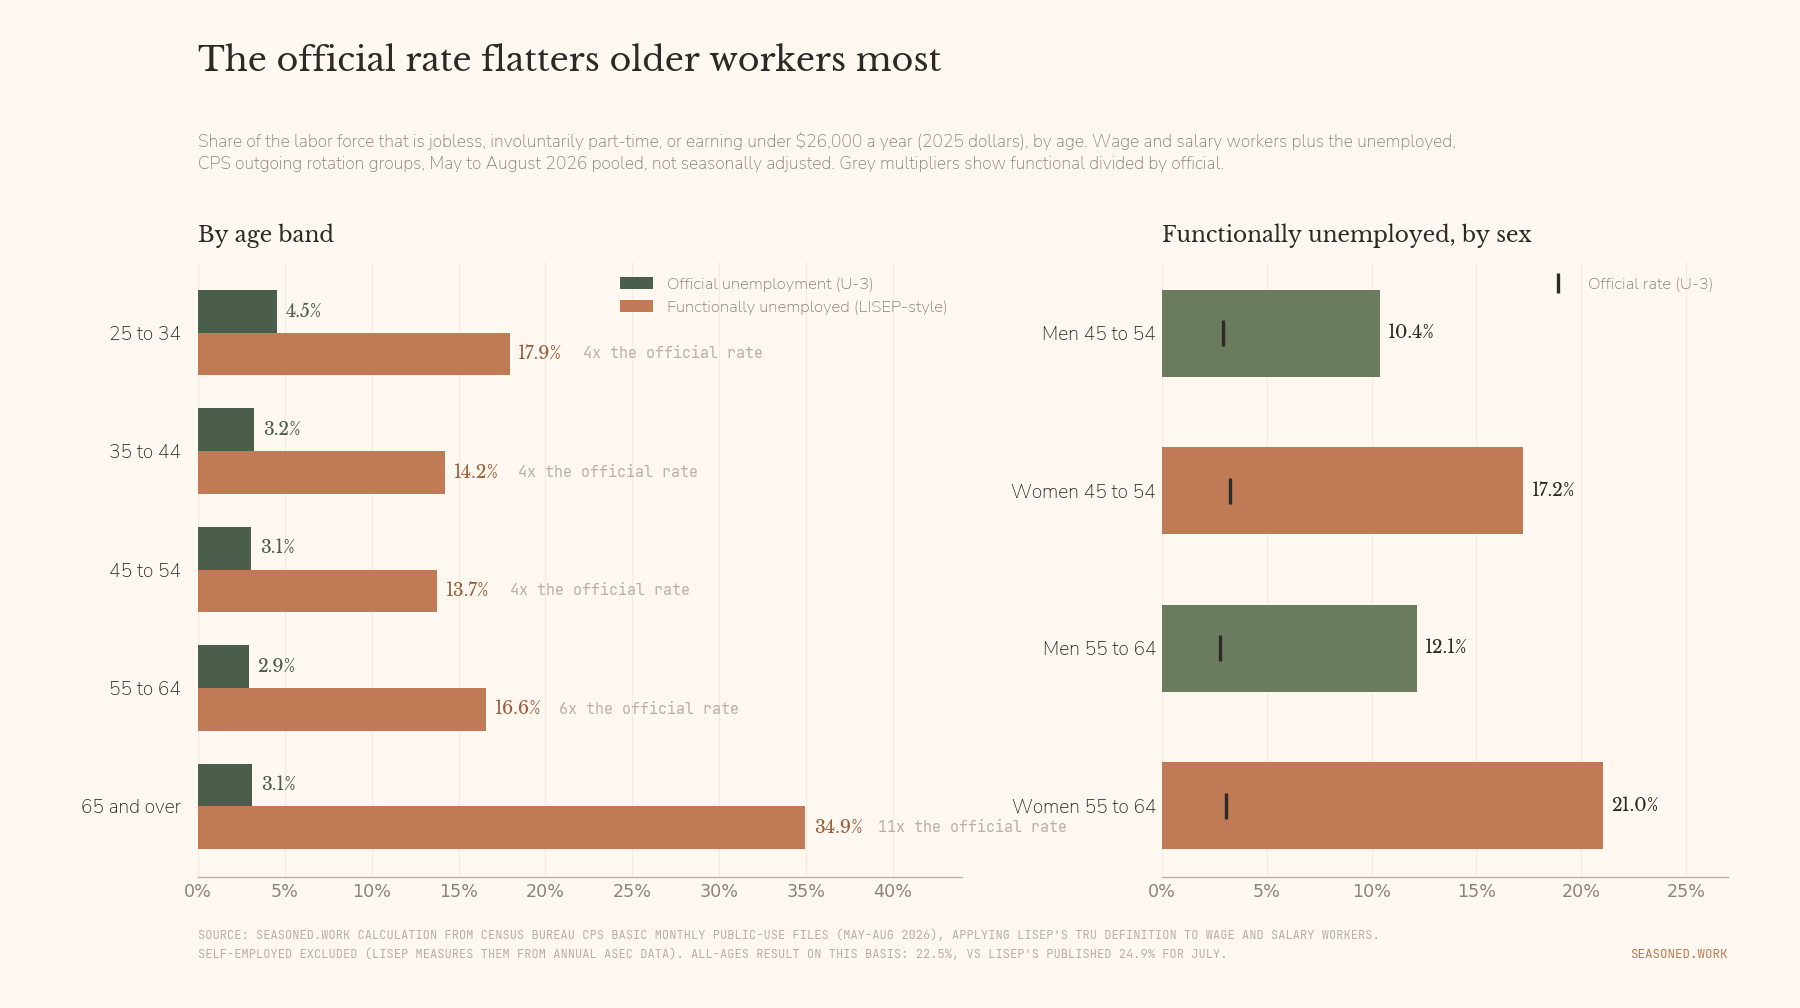
Here is what the age cut shows. The official unemployment rate is lowest for workers 55 to 64, at 2.9 percent. Lower than 25 to 34, lower than 45 to 54. By the headline measure, older workers have the best labor market of anyone. Apply the functional test and the order flips. Workers 55 to 64 come in at 16.6 percent, above 45 to 54 at 13.7 and 35 to 44 at 14.2. The gap between official and functional runs roughly four to one for everyone under 55 and almost six to one for 55 to 64. The official rate flatters older workers more than any other group, because the thing that happens to older workers is not joblessness. It is the sub-$26,000 job: 8.9 percent of 55-to-64 wage and salary workers in the labor force are working but earning under the line, against 6.4 percent of 45-to-54s. That is the contract gig, the fractional role, and the consulting scraps, counted.
The official rate flatters older workers most
Official unemployment against a LISEP-style functional rate, by age and by sex. Seasoned.Work calculation from CPS public-use microdata, May to August 2026.
Source: Seasoned.Work calculation from Census Bureau CPS Basic Monthly files, applying LISEP's TRU definition; self-employed excluded
Seasoned.Work
Split it by sex and it gets sharper. Women 55 to 64 are 21.0 percent functionally unemployed against an official rate of 3.1. Men in the same band are at 12.1. For Gen X proper, ages 46 to 61 this year, the functional rate is 18.1 percent for women and 10.8 percent for men, against official rates of about three percent for both. In round numbers, about 6.2 million Gen X workers are in the labor force with no job, not enough hours, or not enough pay. The headline count for the same group is about 1.5 million.
The 65-and-over band reads 34.9 percent, and I would not lean on it. LISEP's earnings test applies to everyone, including people who chose a 15-hour week in semi-retirement and earn under $26,000 by design. Some of that band is functionally unemployed by any definition. Some of it is a choice the measure cannot see. The 55 to 64 number has no such excuse.
The thresholds LISEP chose, 35 hours and $26,000, describe the exact shape of the landing spot the hiring infrastructure builds for experienced workers it has rejected. The seventh number is, among other things, a measure of how many people have been quietly converted from careers into gigs while the headline rate congratulates itself. Now there is a number for it by age, and it points where this site has been pointing for fifteen articles.
LISEP's companion measures fill in the rest. Its True Weekly Earnings figure, which includes part-timers and the jobless who are looking rather than only the full-time workers the BLS median covers, came in at $1,033 a week for the second quarter, against a headline BLS figure of $1,251. That is a 17 percent haircut on what the median worker actually takes home once you stop excluding the people the market has pushed to the margins. And its True Living Cost index says the price of a minimal, secure life has risen 106 percent since 2001 while the CPI rose 77 percent. Earnings down, cost of a basic life up faster than the official inflation gauge, and a quarter of the labor force in a job that does not function as one. That is the picture the seventh number paints when you set it next to the other six.
The Divergence
"Functional unemployment is moving higher while workforce participation is moving lower. If this continues, it would suggest the labor market is losing strength despite what we may see in the headline unemployment numbers." Gene Ludwig, August 20, 2026.
How to Read the Seventh Number
Habit 01
Read the level once, then watch the direction
A number near 25 percent describes how the labor market has always been built, and it has been higher for most of the series. Four straight monthly increases while the headline rate falls is the divergence, and divergence is the signal.
Habit 02
Watch the women's line
It is moving fastest: 31.0 percent in July, a 1.6-point jump in one month, the widest gender gap in the series in years. When one demographic breaks away from the rest, the aggregate is late.
Habit 03
Pair it with True Weekly Earnings
A rising functional unemployment rate with falling real median earnings is the combination that shows up in the household budget long before it shows up at the Fed. Check both each quarter.
How to Use It
Add it to the toolkit I laid out in August, not in place of anything already there. Read the level once to understand how the labor market is built, then ignore it and watch the direction. Four straight monthly increases while the headline rate falls is the divergence, and divergence is the signal. Watch the women's line, which is moving fastest. And pair the rate with True Weekly Earnings each quarter, because a rising functional unemployment rate with falling real median earnings is the combination that shows up in the household budget long before it shows up at the Fed.
Close
The official unemployment rate tells you how many people have no work. The seventh number tells you how many people have work that does not do the job of a job. Both are true. Only one of them is in the headline, and it is the one that makes everyone feel better.
Four percent of the labor force cannot find a job. Twenty-five percent cannot find one that pays. Only one of those numbers gets a press conference.
Sources: Ludwig Institute for Shared Economic Prosperity, True Rate of Unemployment (July 2026 release, Aug 20, 2026); LISEP True Weekly Earnings (Q2 2026, Jul 22, 2026); LISEP True Living Cost Index; LISEP TRU and TWE Methodology (June 2024); BLS, The Employment Situation (July and August 2026); Fortune (Aug 30, 2026); Macro Mostly, "True Unemployment Rate: The Pollyanna of the 2023-2026 Labor Market"; U.S. Census Bureau, CPS Basic Monthly Public-Use Files (May to Aug 2026); BLS Table A-15 and CPI-U via FRED.
The Brief
One email a week. Workforce economics, hiring signals, cultural dispatches. No filler.